Charts and visuals that stay editable
Turn numbers into 24 kinds of editable charts and turn ideas into diagrams. Paste data from a spreadsheet, import a CSV or Excel file, and every chart picks up your theme colours. When a document has numbers, the AI charts them. When it has none, it uses diagrams instead of inventing data.
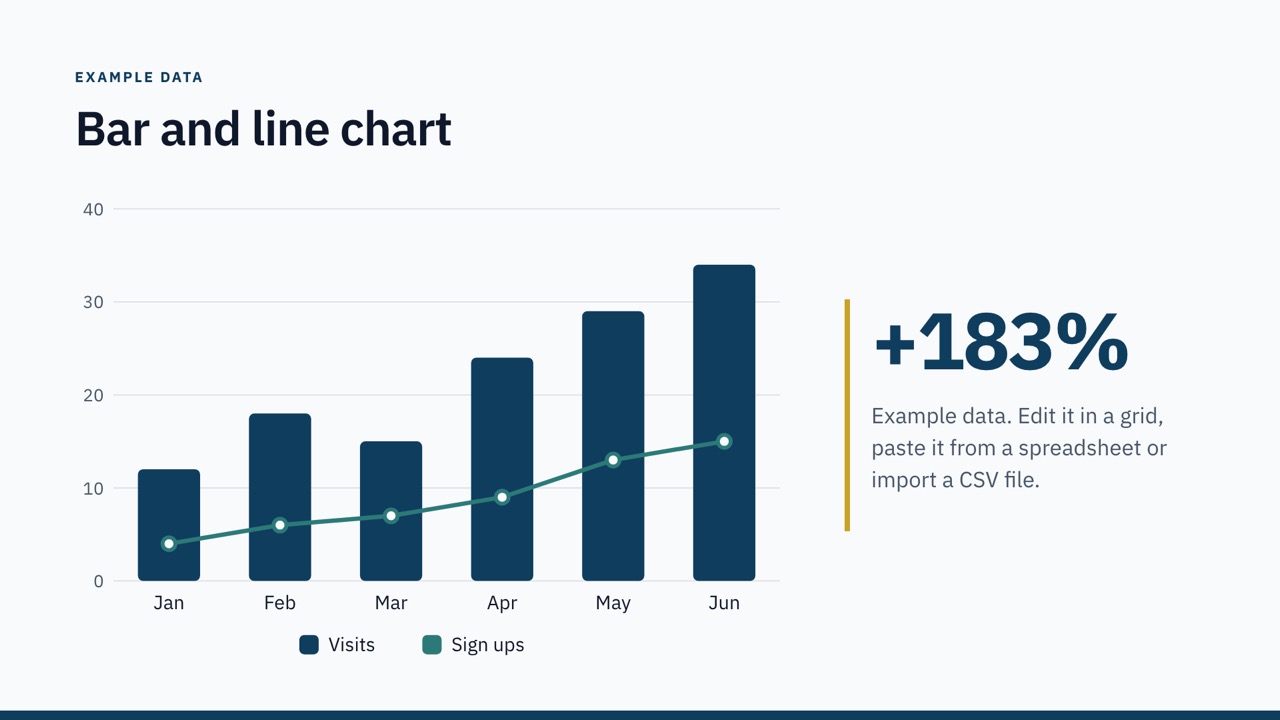
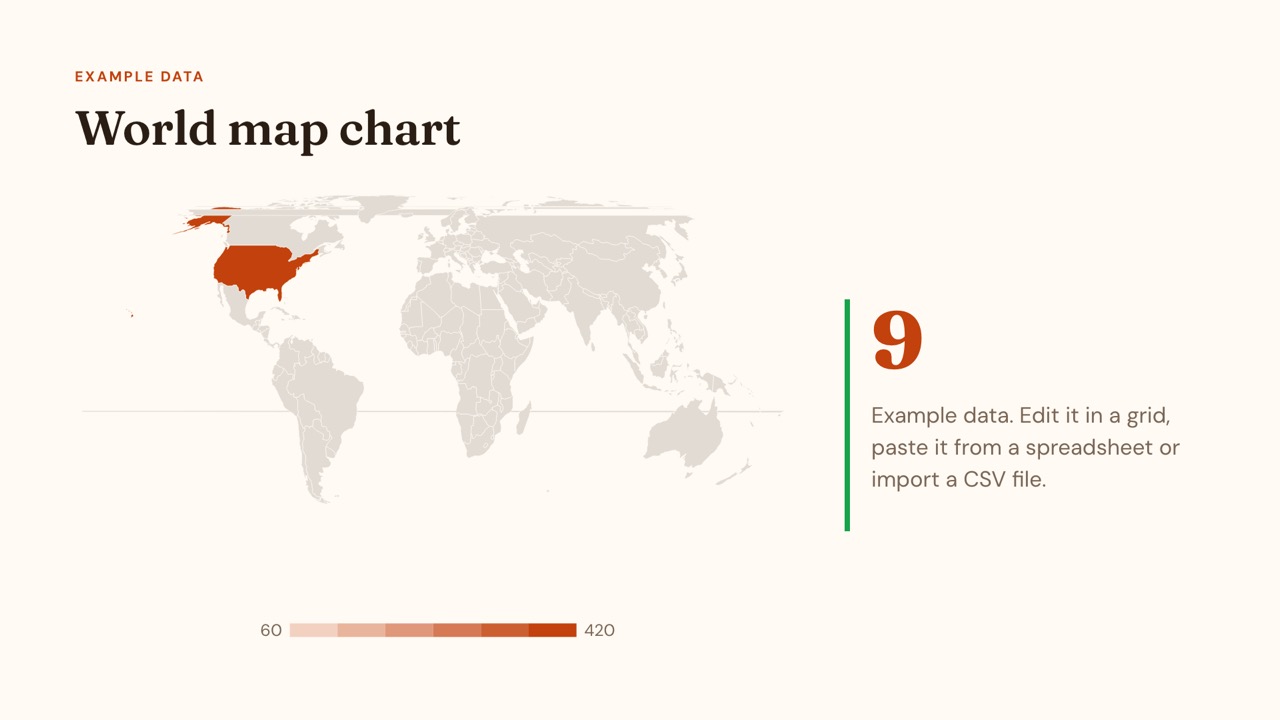
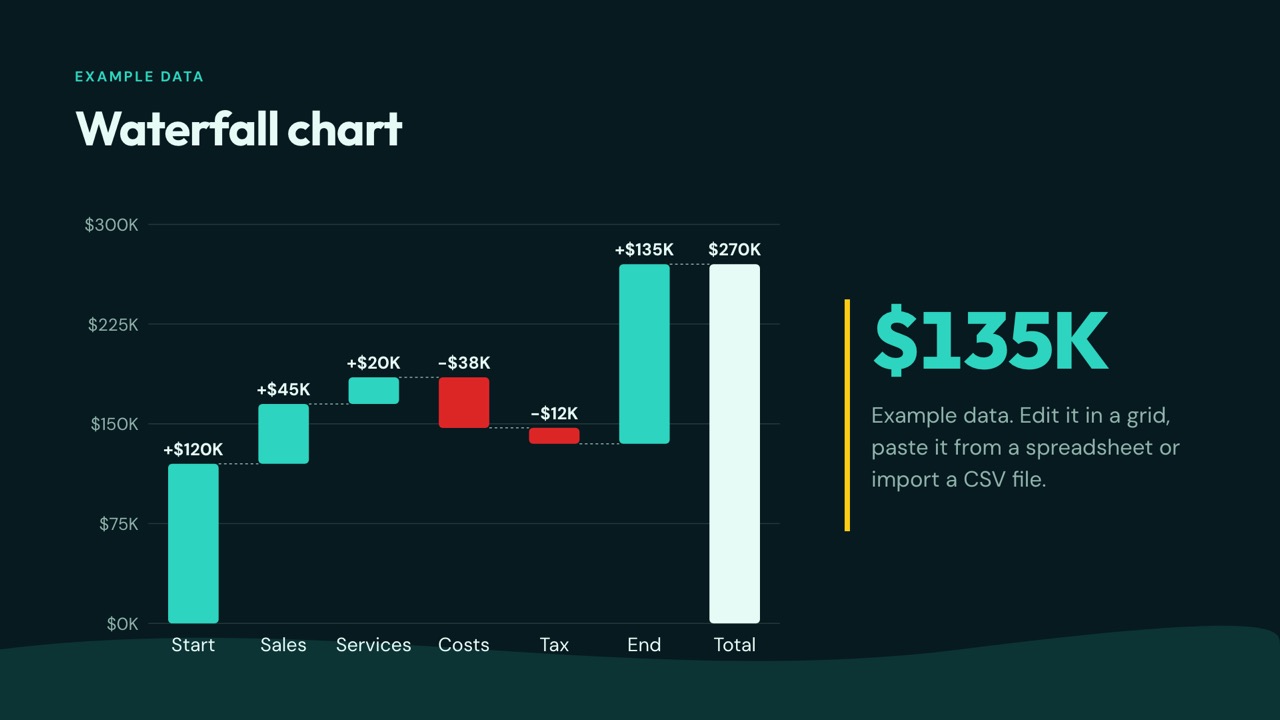
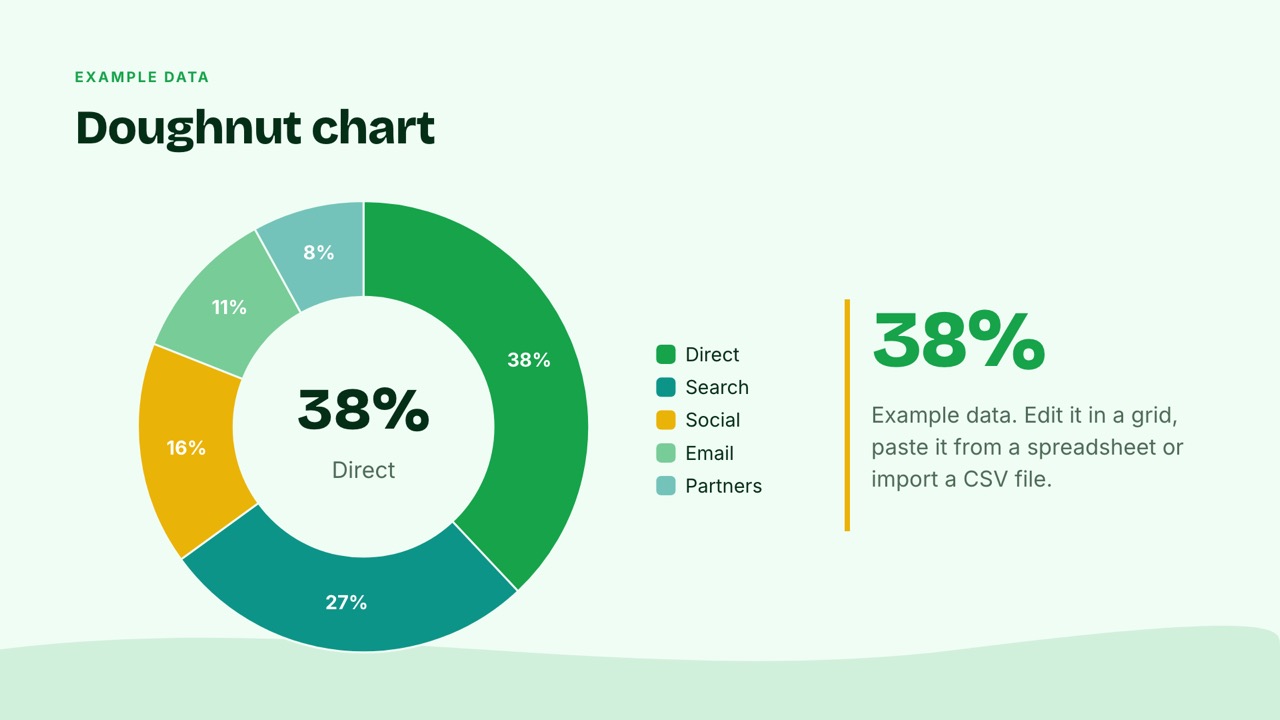
Every chart you need
Column, bar, stacked and 100% stacked, line, area, combo bar and line, scatter, bubble, pie, doughnut, radar, funnel, waterfall, gauge, treemap, heatmap and maps shaded by country. Each one is drawn from data you can open and change at any time.
- Data grid with paste from a spreadsheet
- CSV and Excel import
- Number formats, axes, labels and legends
Infographics in one click
Stat callouts, icon arrays, comparison bars, process and cycle diagrams, org charts, mind maps, venn diagrams, pyramids, 2x2 matrices and timelines. Every block is made of shapes and text you can edit, recolour and animate.
- Theme aware colours
- Every label editable
- Build them in step by step
Honest by design
When you give the AI a report with figures, it builds real charts from those figures. When there are no numbers, it reaches for timelines, processes and diagrams instead. It never fills a chart with made up data.
- Charts only from your numbers
- Diagrams when there are none
- Speaker notes explain each chart
Native in PowerPoint, sharp in PDF
Exported decks keep standard charts as real PowerPoint charts with their data, so colleagues can keep editing. PDF exports draw every chart and diagram as vectors, crisp at any zoom.
- Editable charts in PowerPoint
- Vector charts in PDF
- Animate a chart by series or category
Every chart and visual, on real slides
Rendered by SlidesBat with example data. Each one stays editable in the editor.
Bar and line World map Waterfall Doughnut 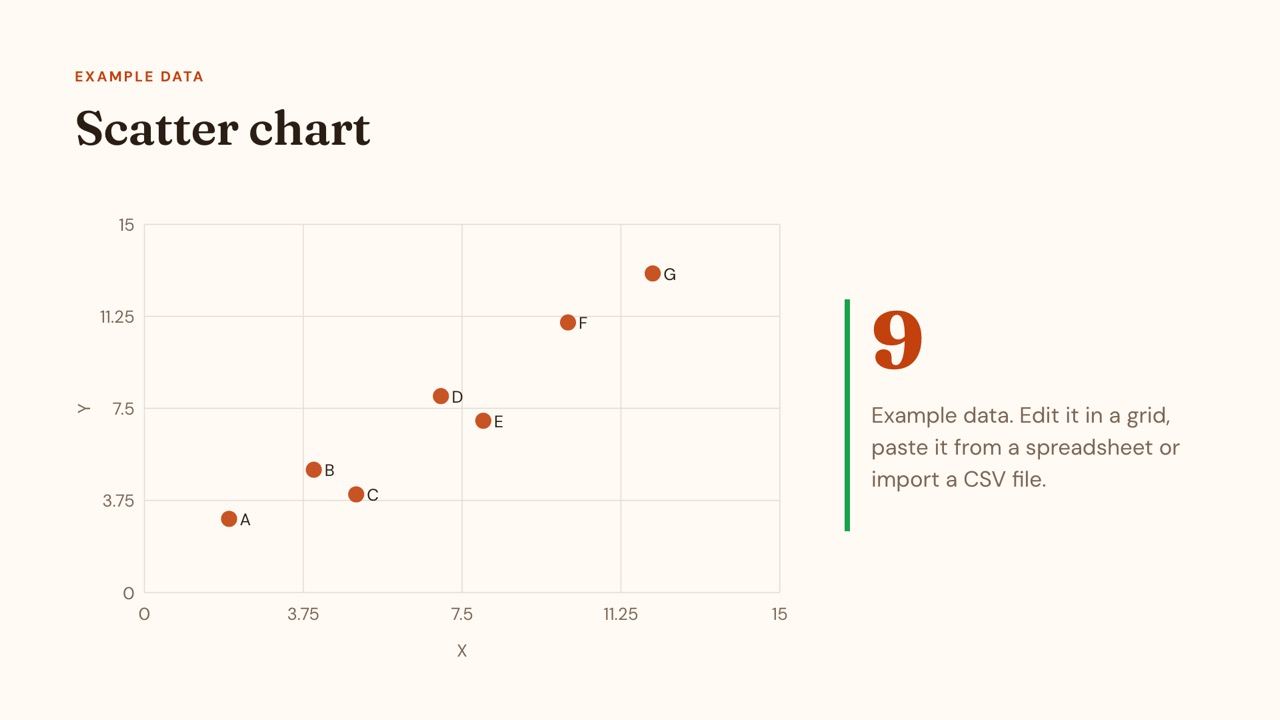
Scatter 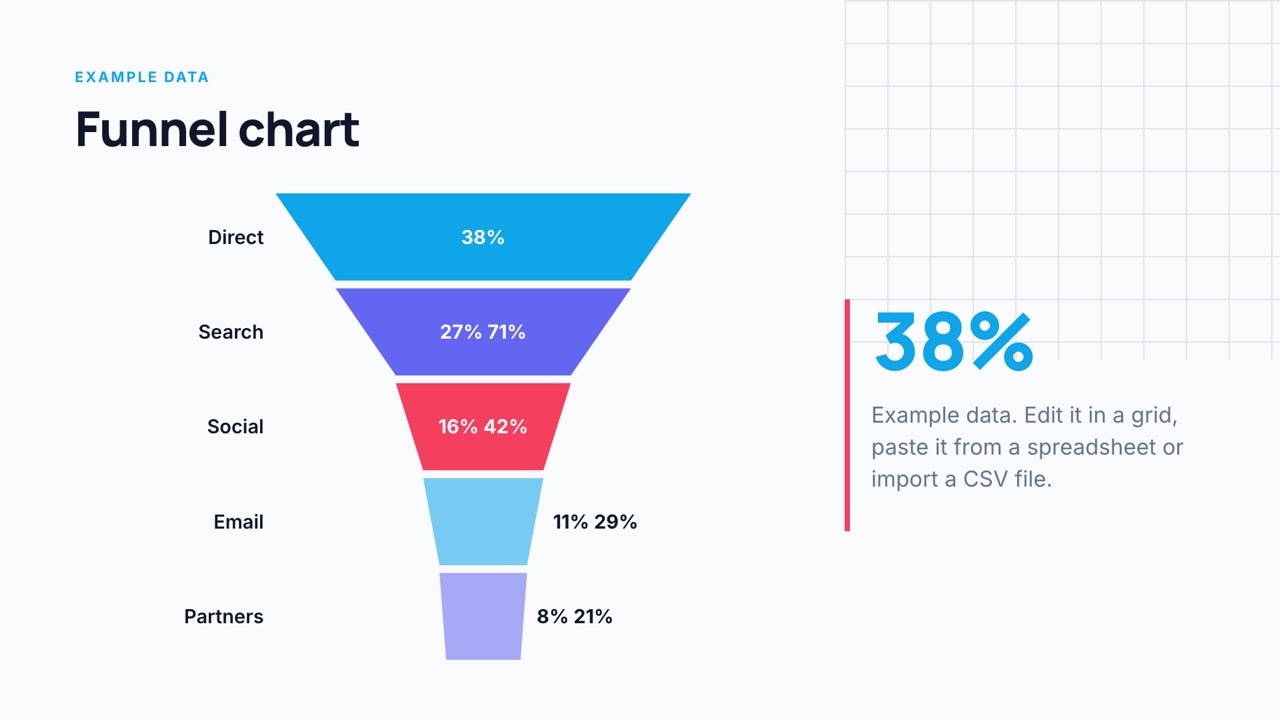
Funnel 
Flow (sankey) 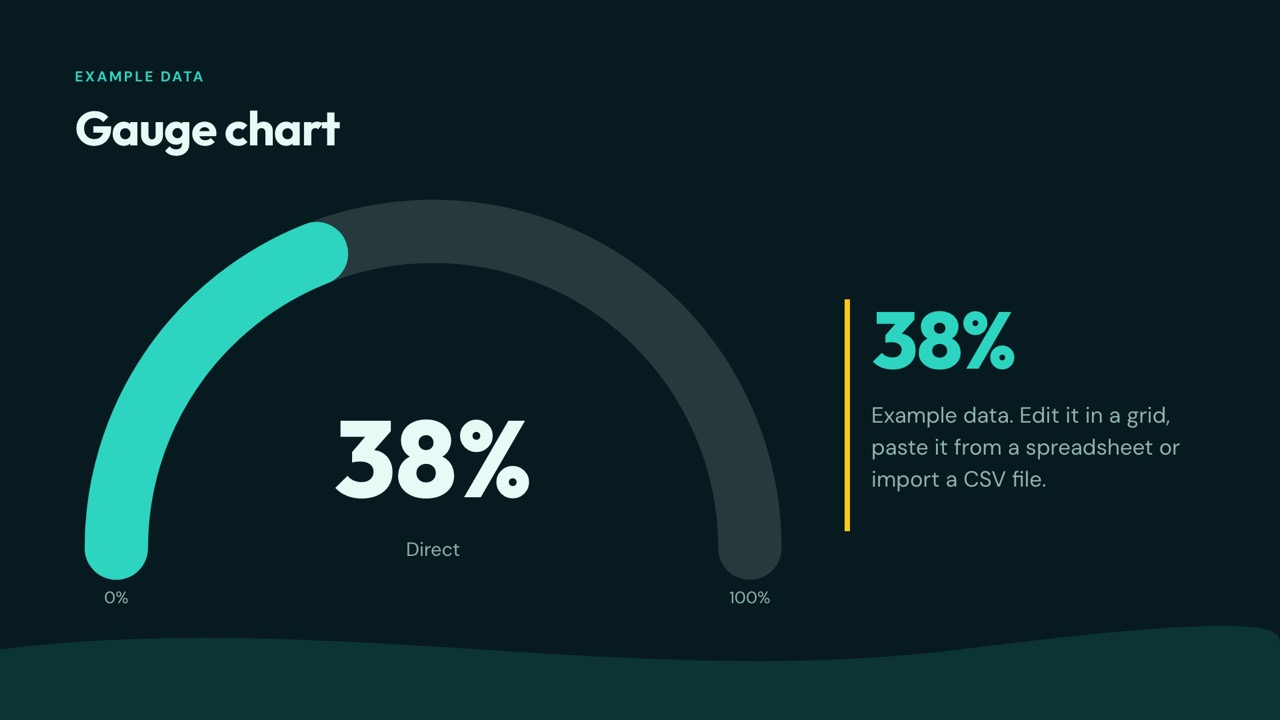
Gauge 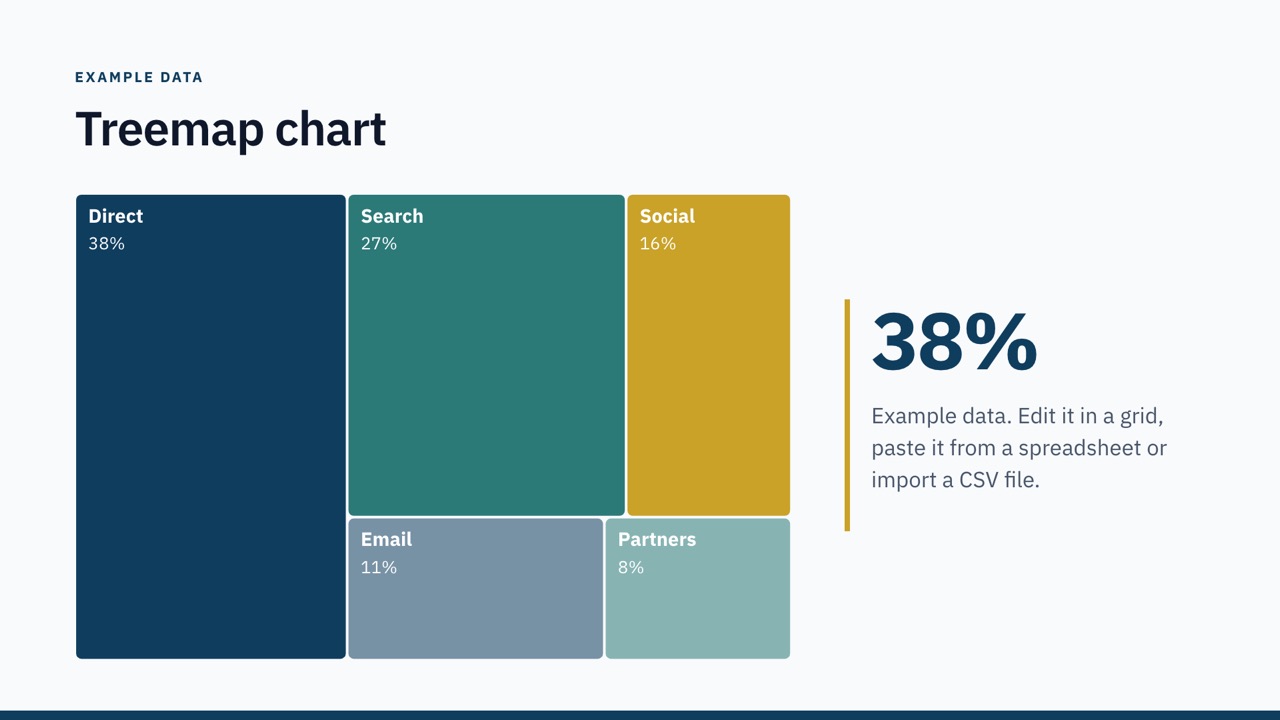
Treemap 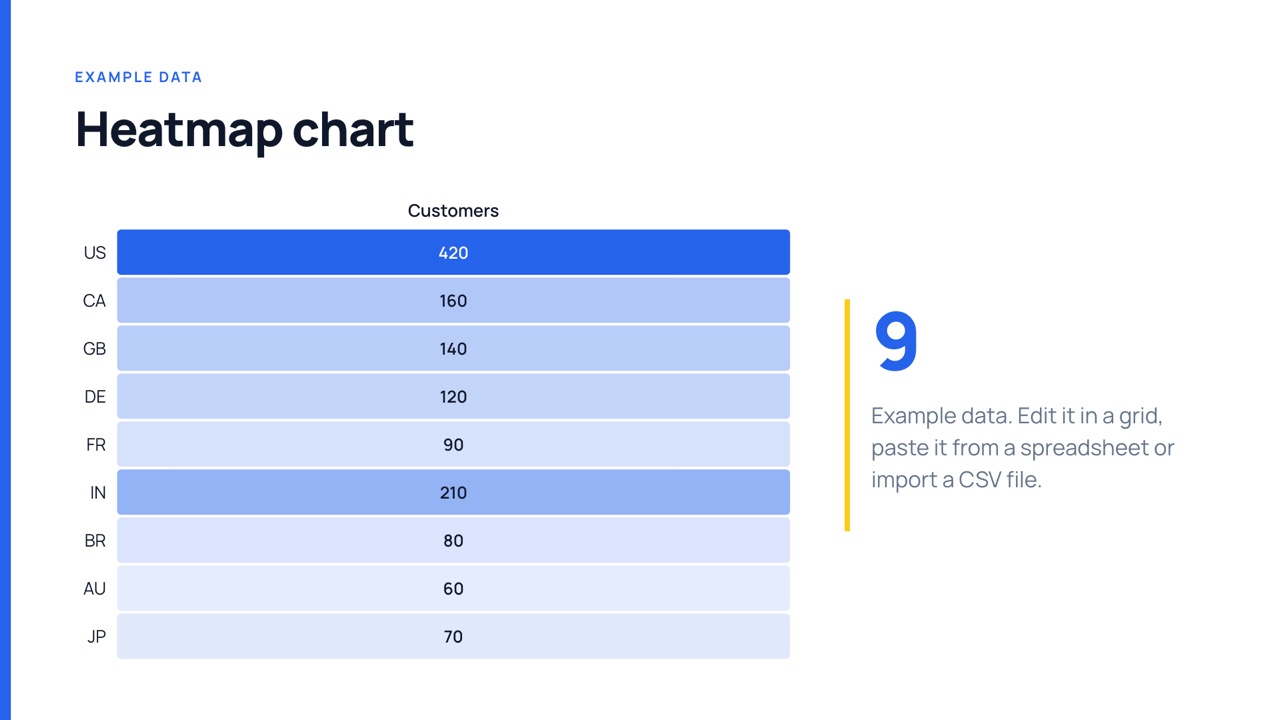
Heatmap 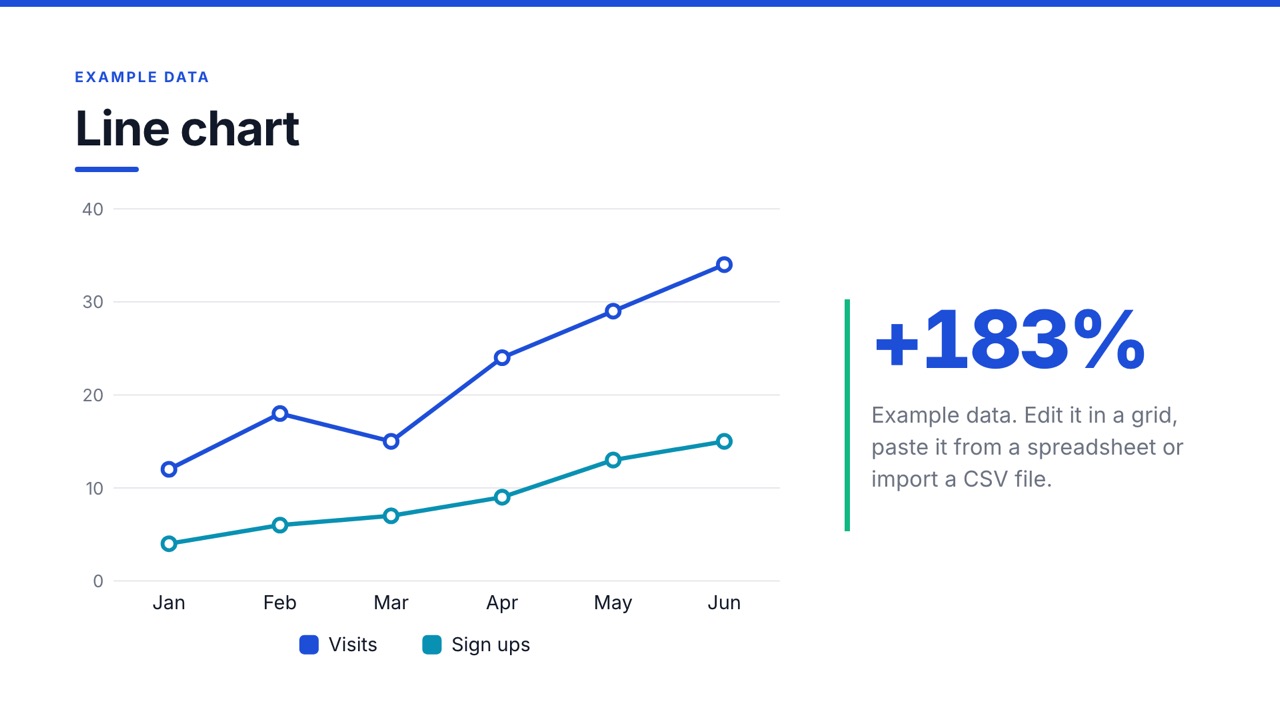
Line 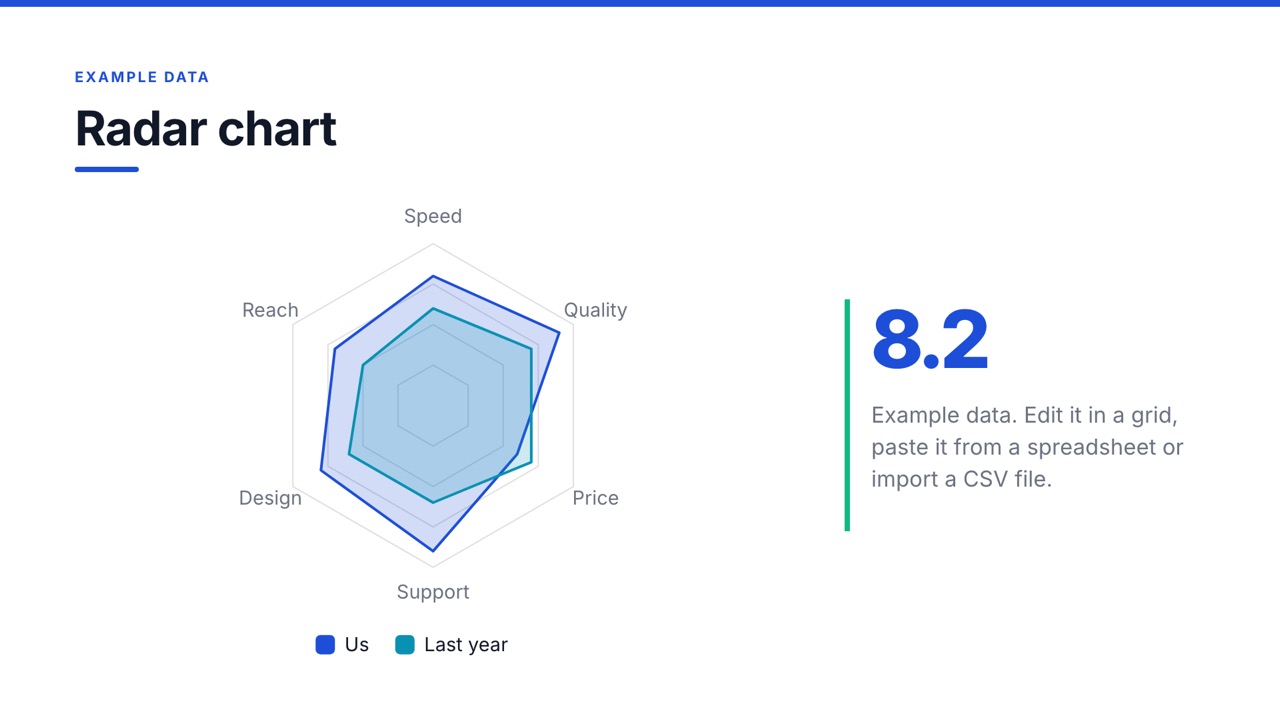
Radar 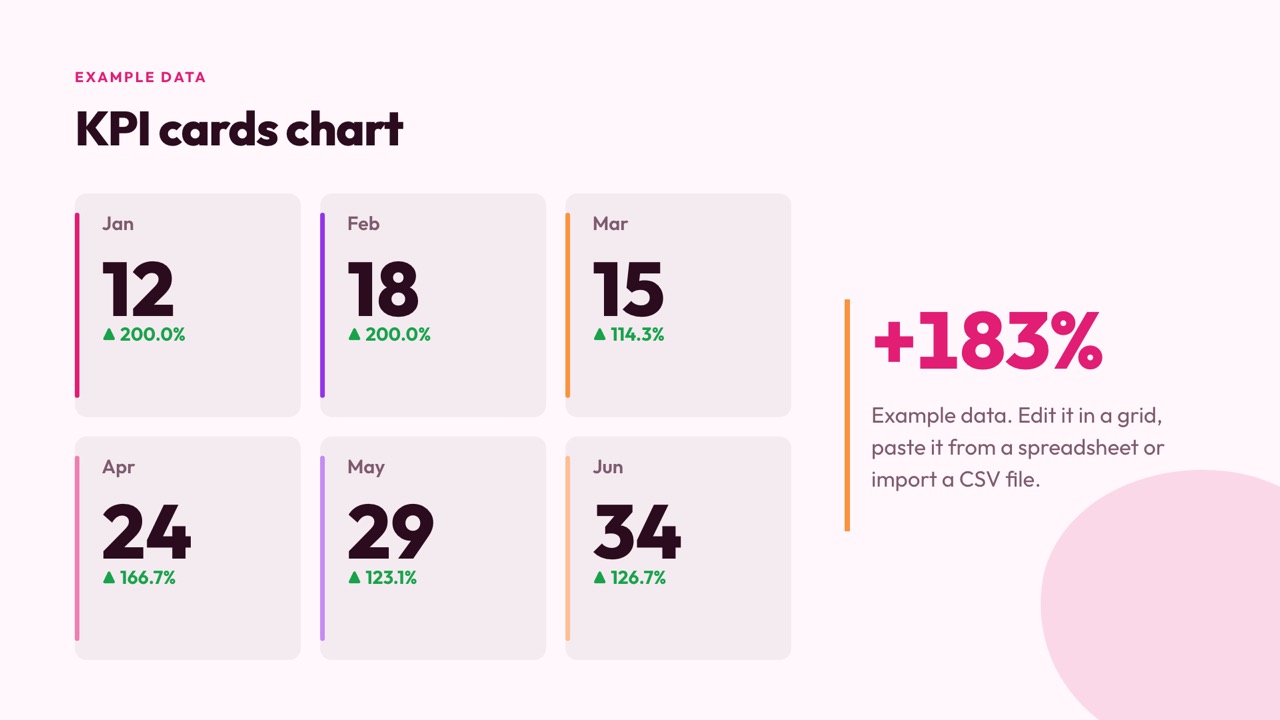
KPI cards 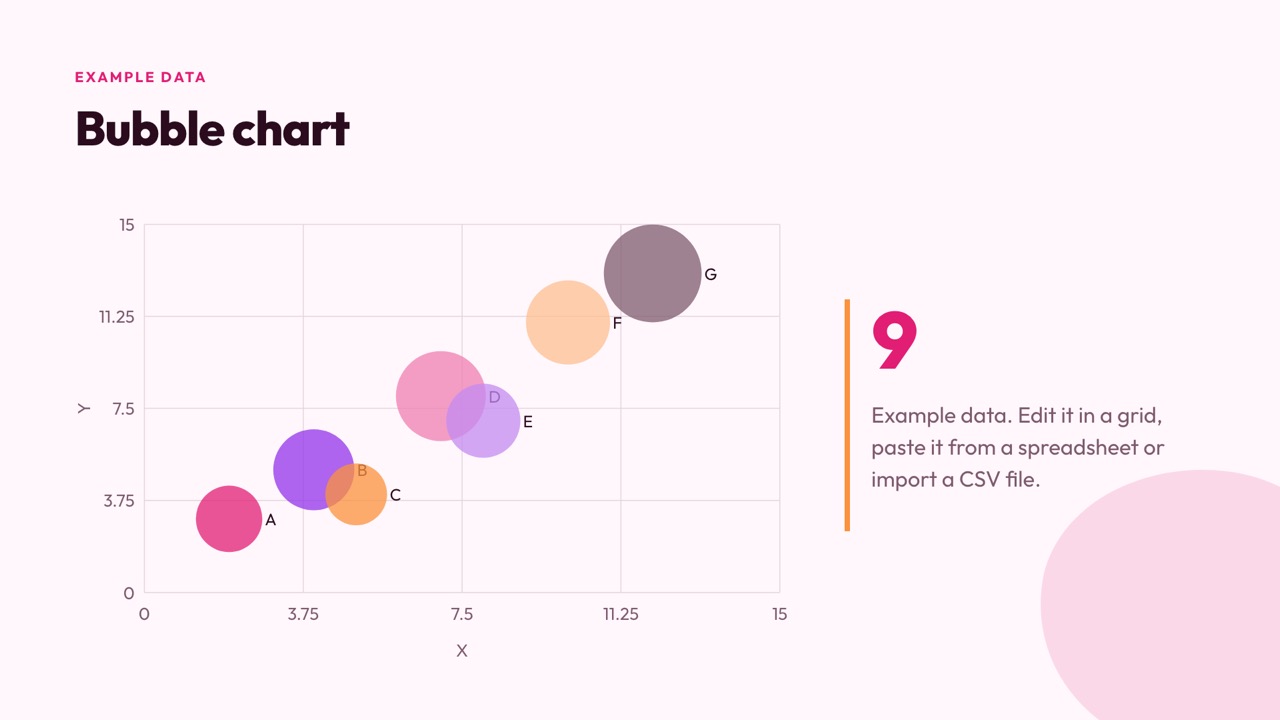
Bubble 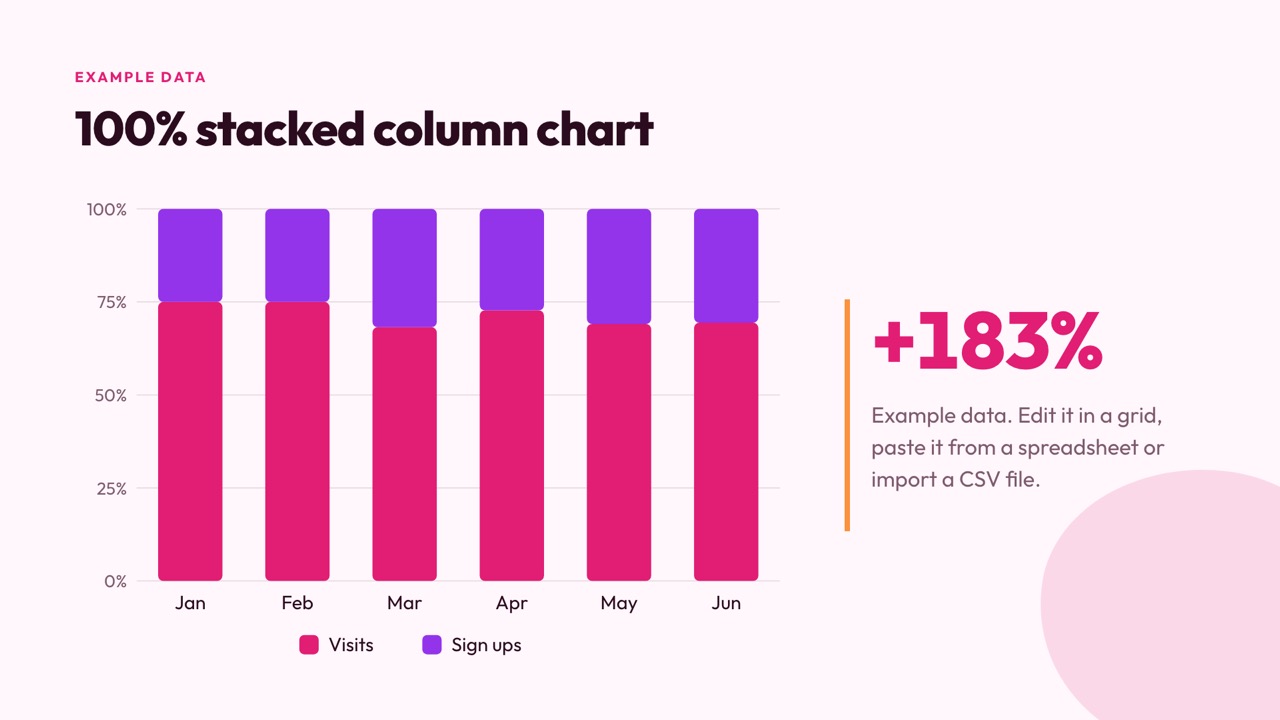
100% stacked column 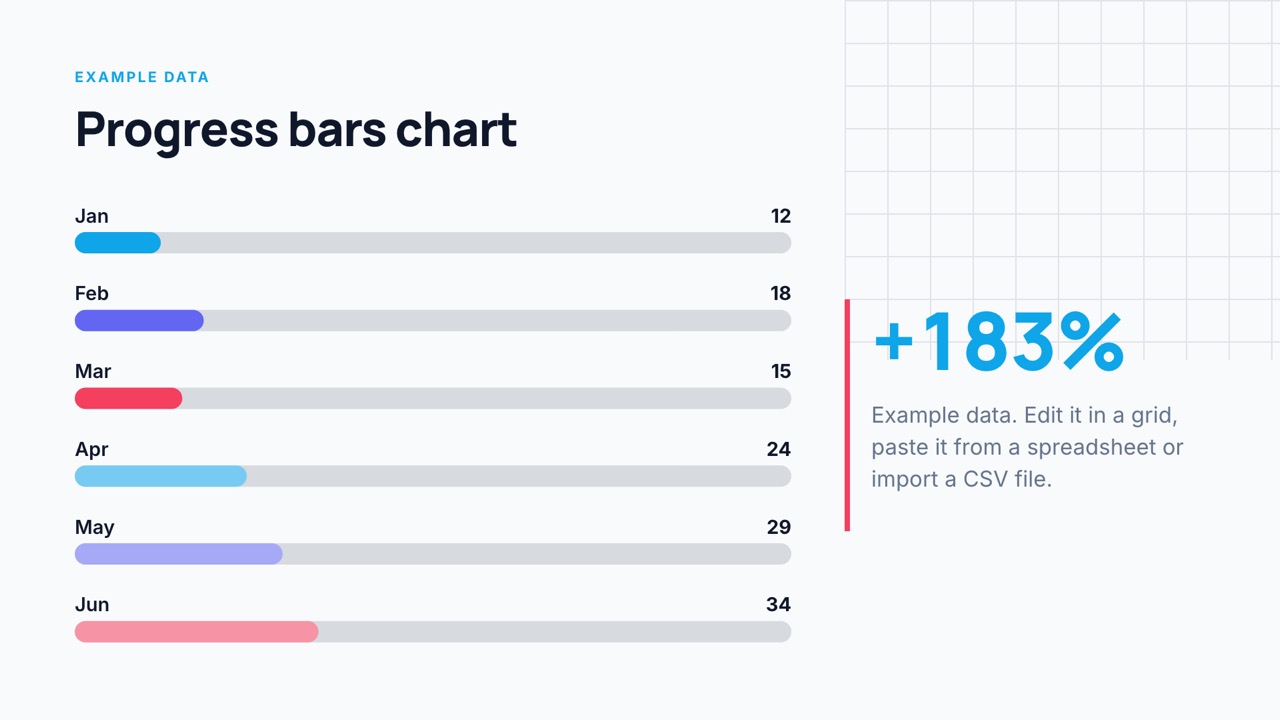
Progress bars 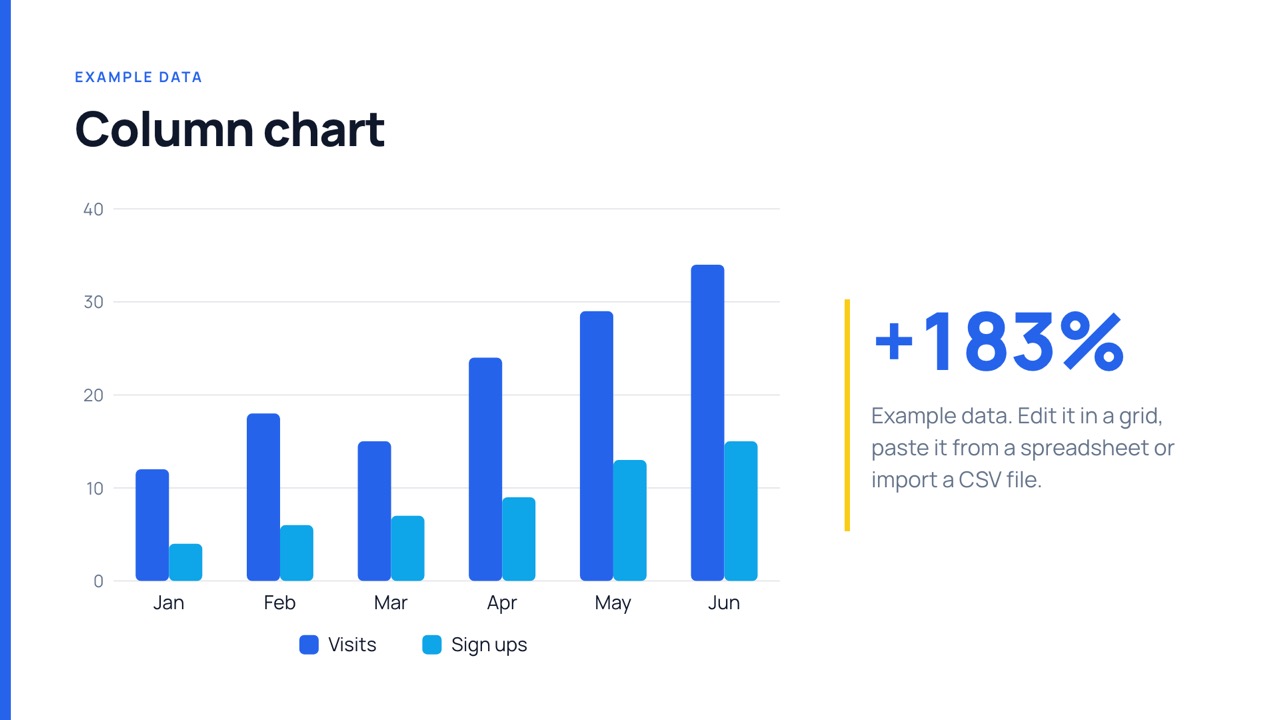
Column 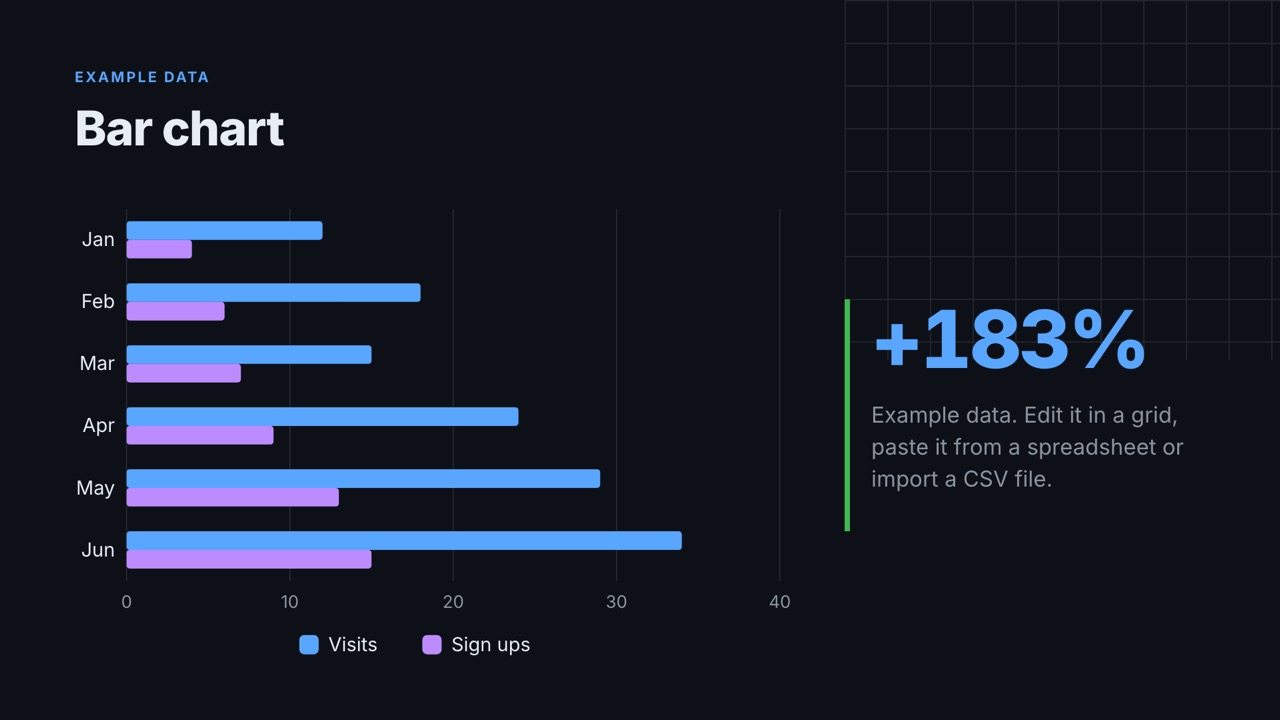
Bar 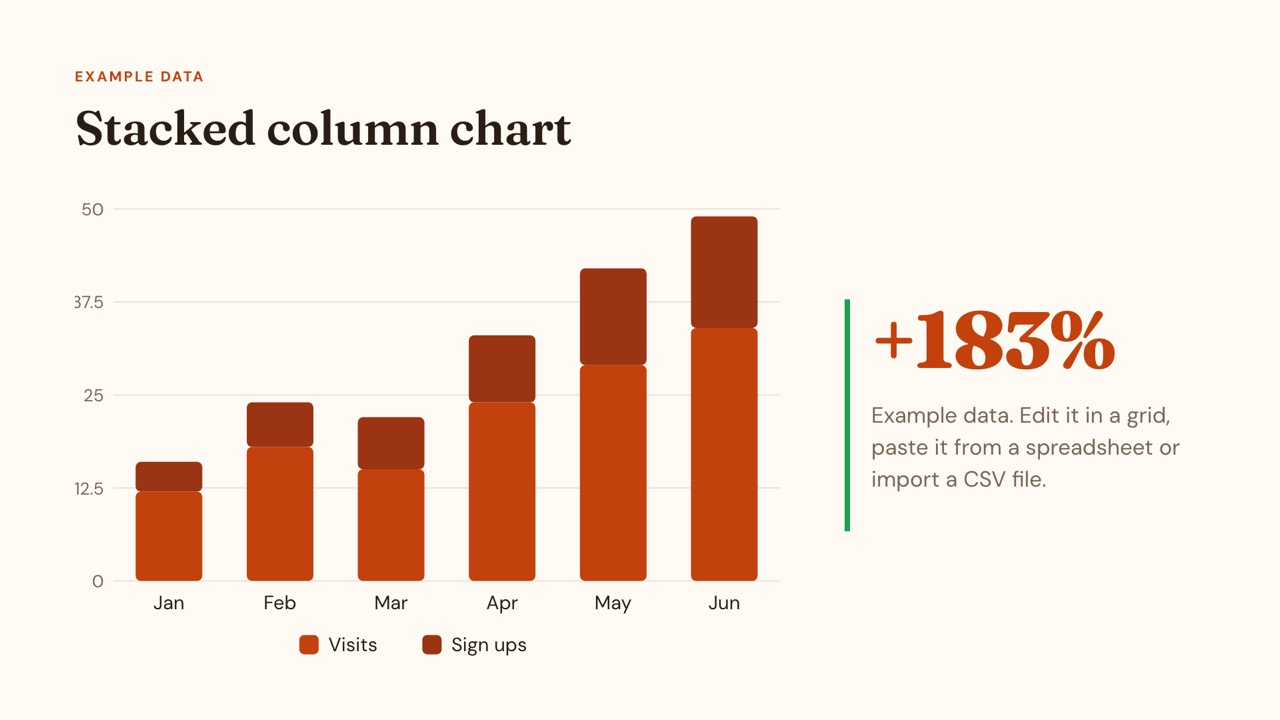
Stacked column 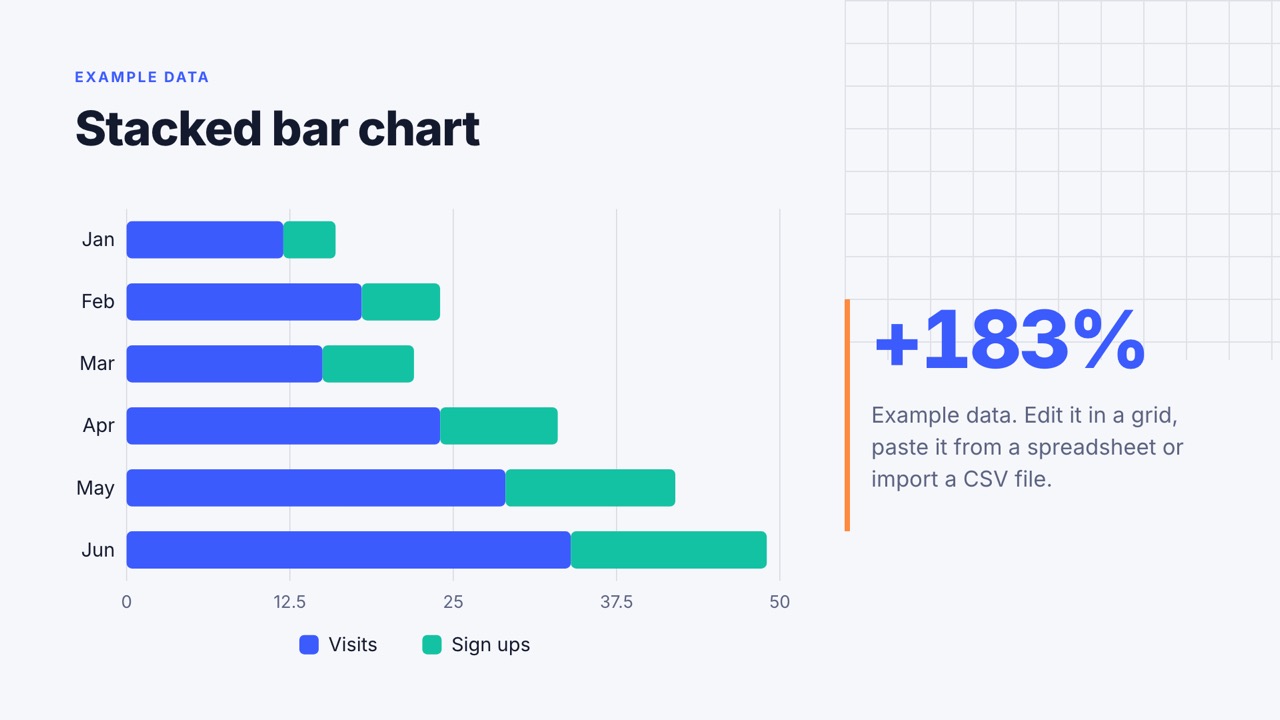
Stacked bar 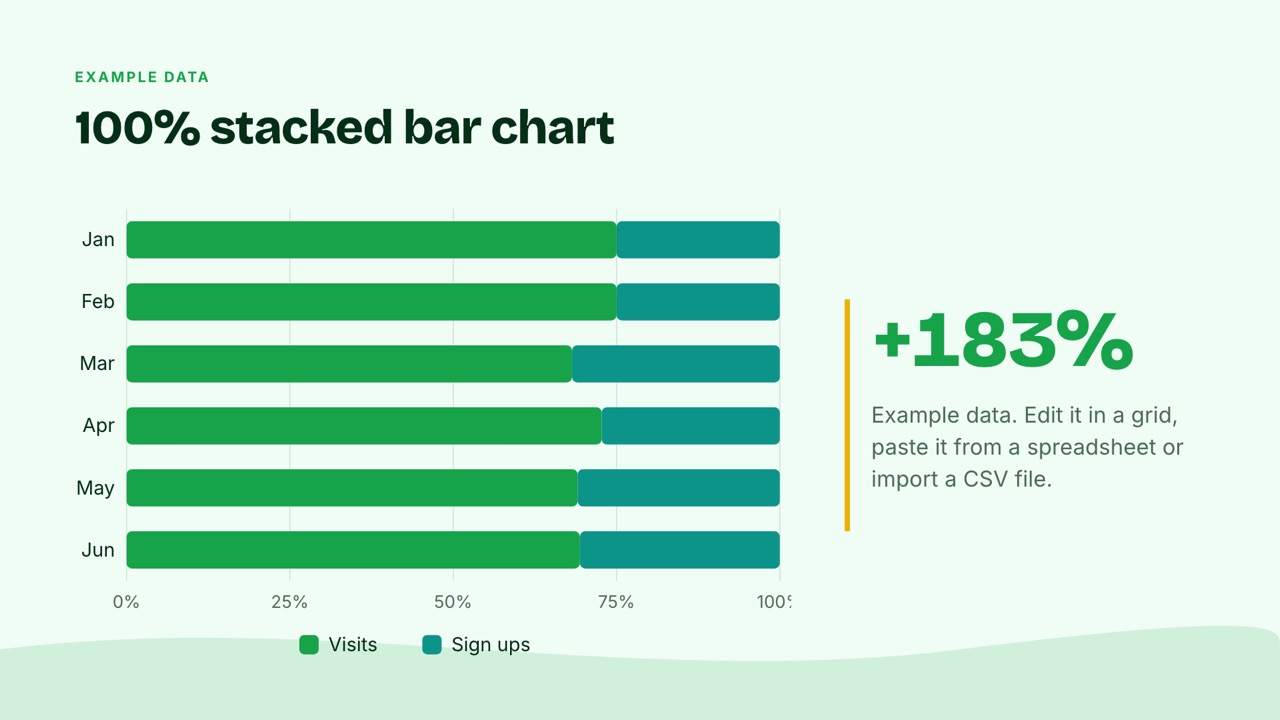
100% stacked bar 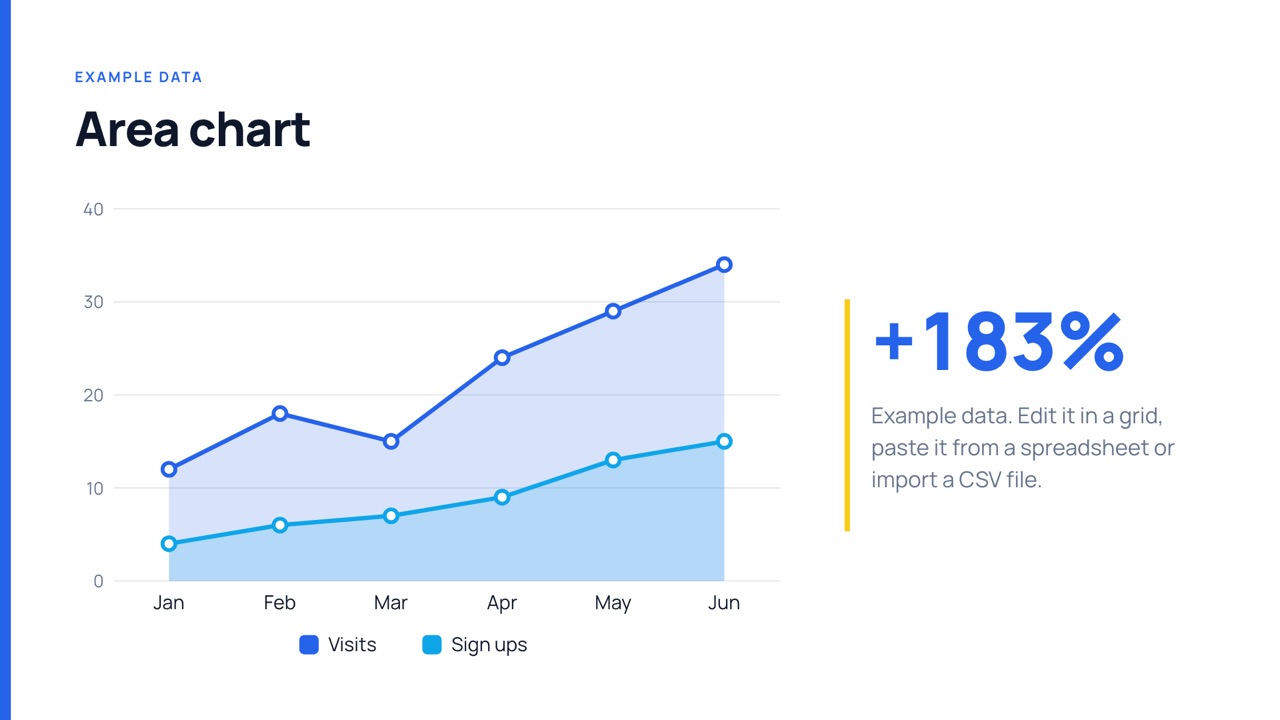
Area 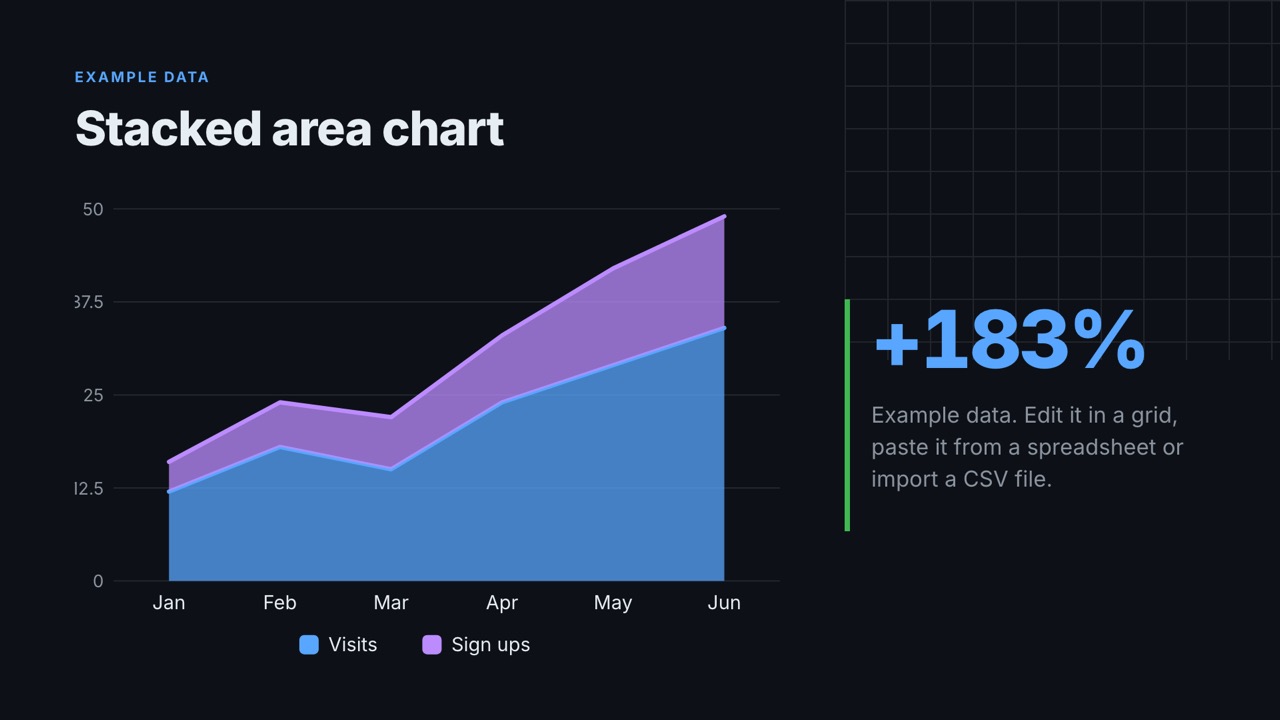
Stacked area 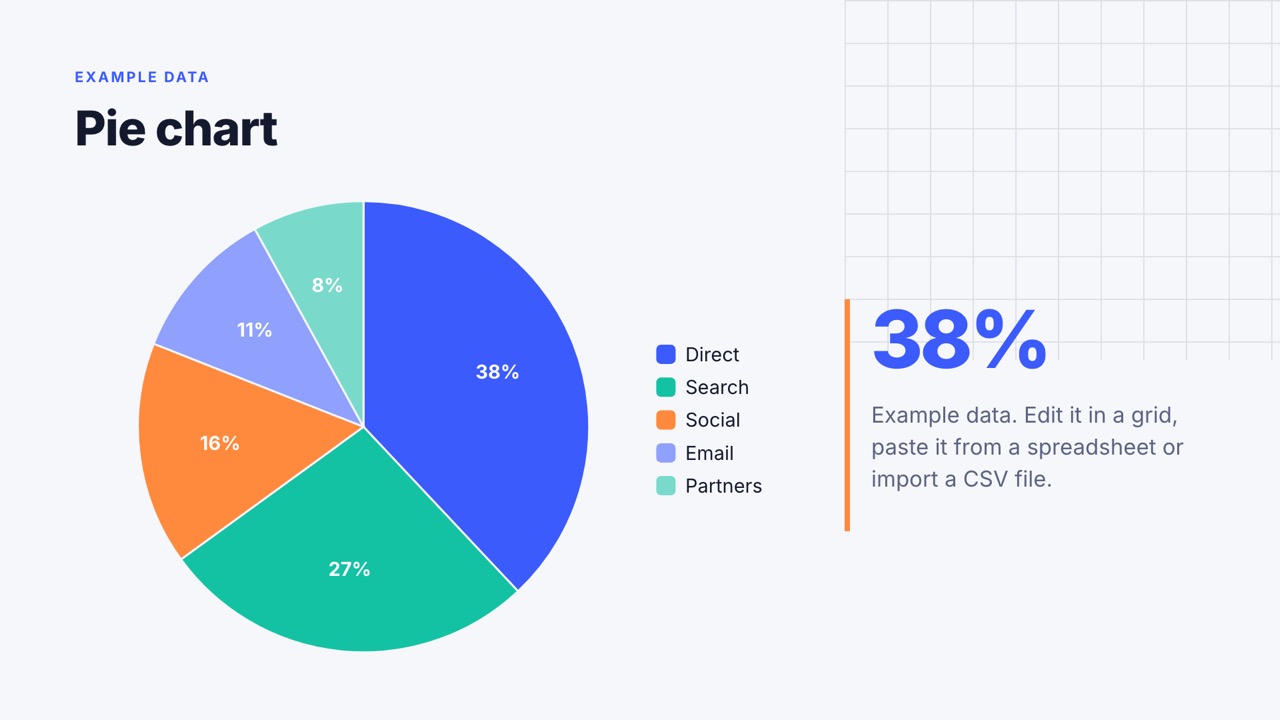
Pie 
Stat callouts 
Icon array 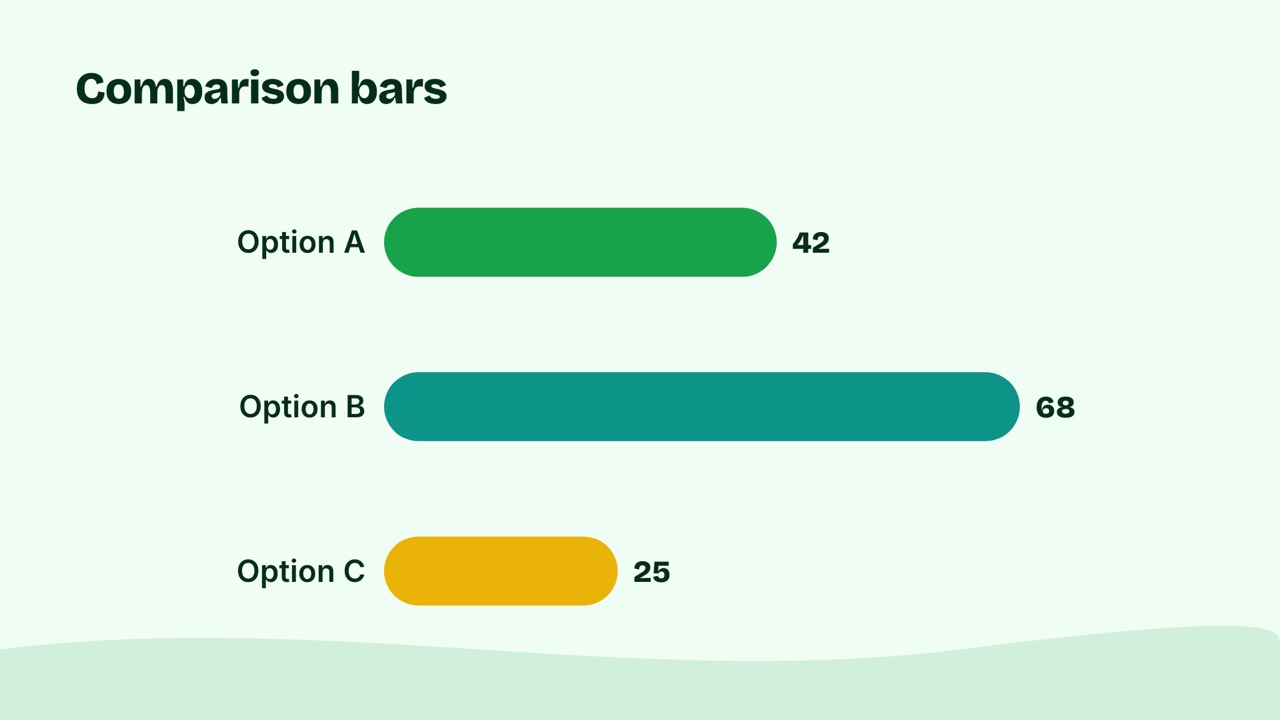
Comparison bars 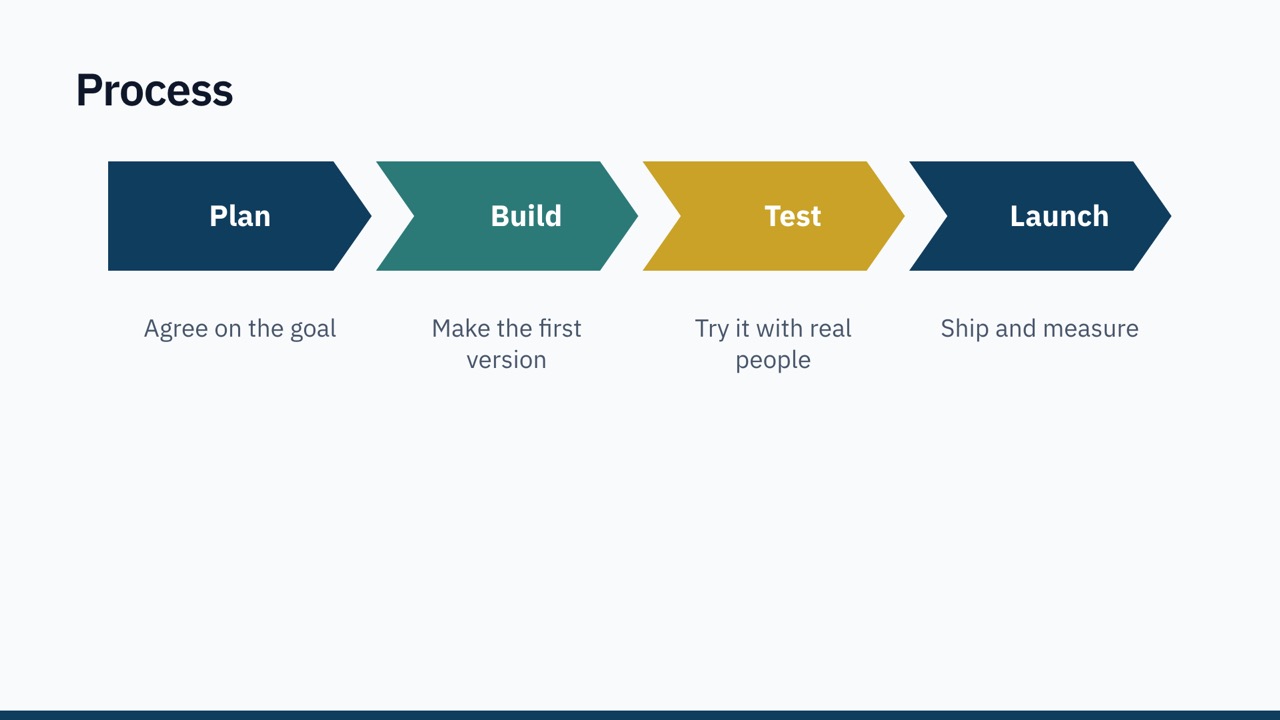
Process 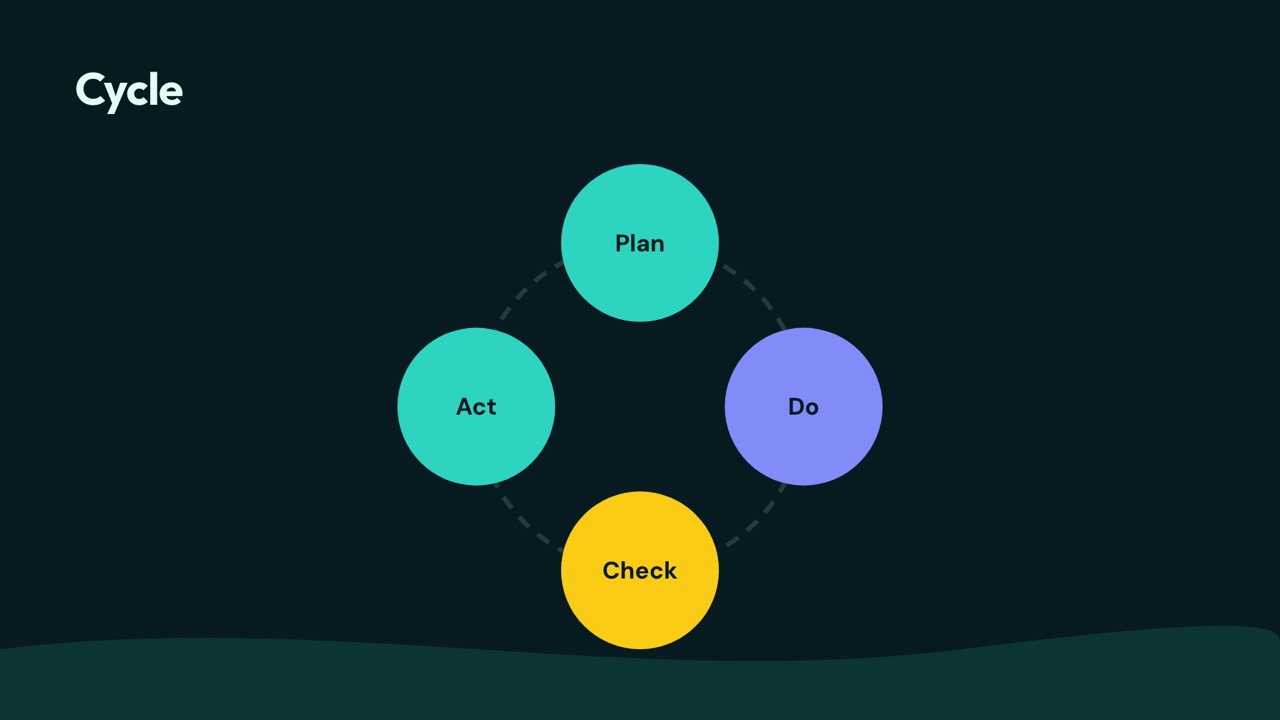
Cycle 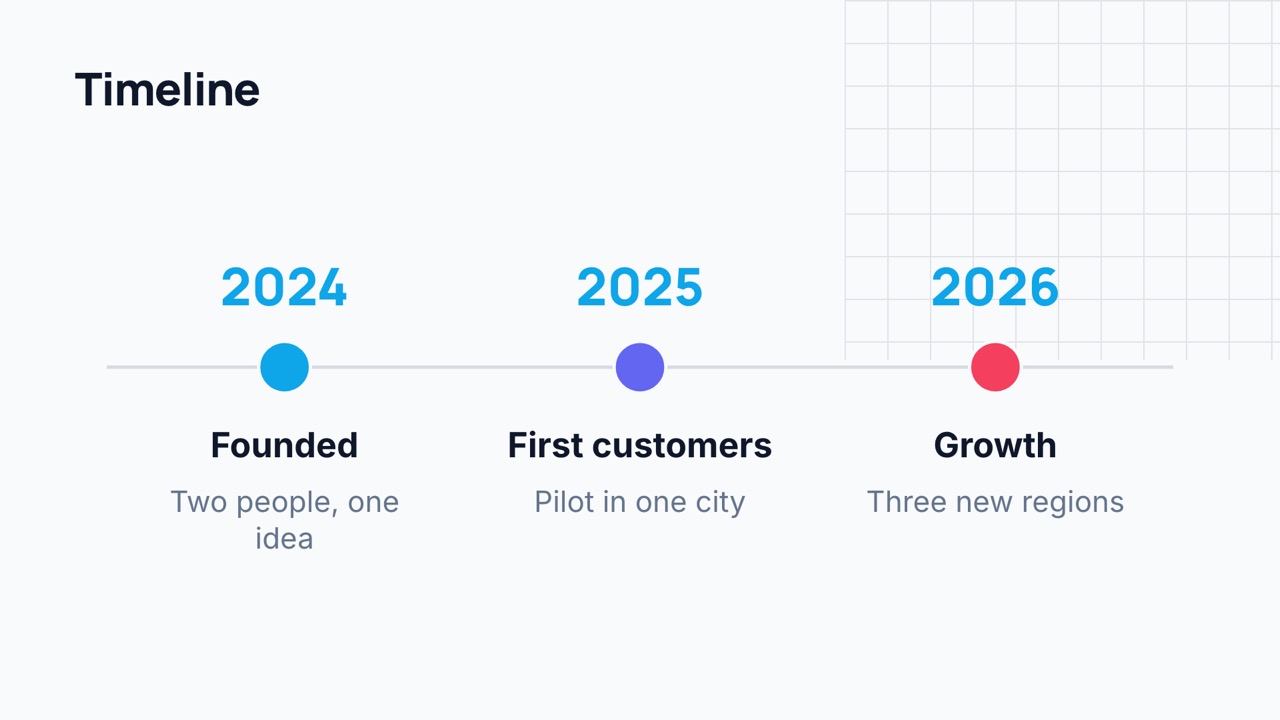
Timeline 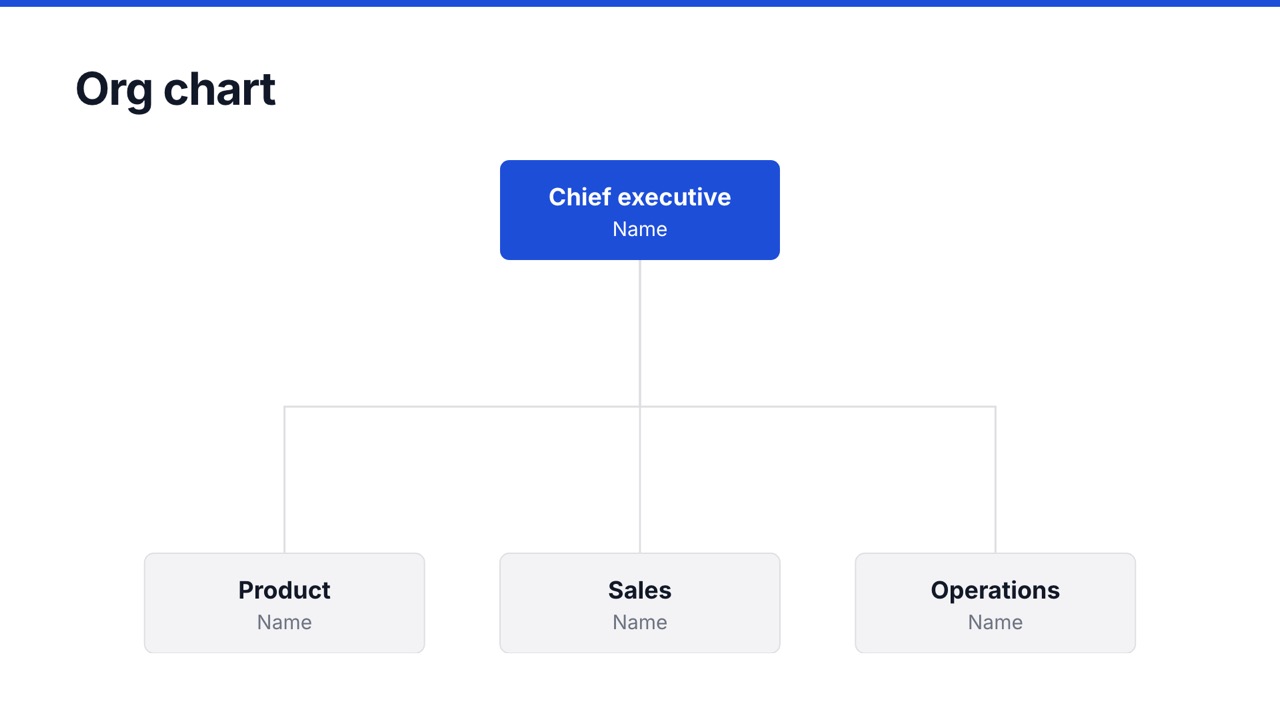
Org chart 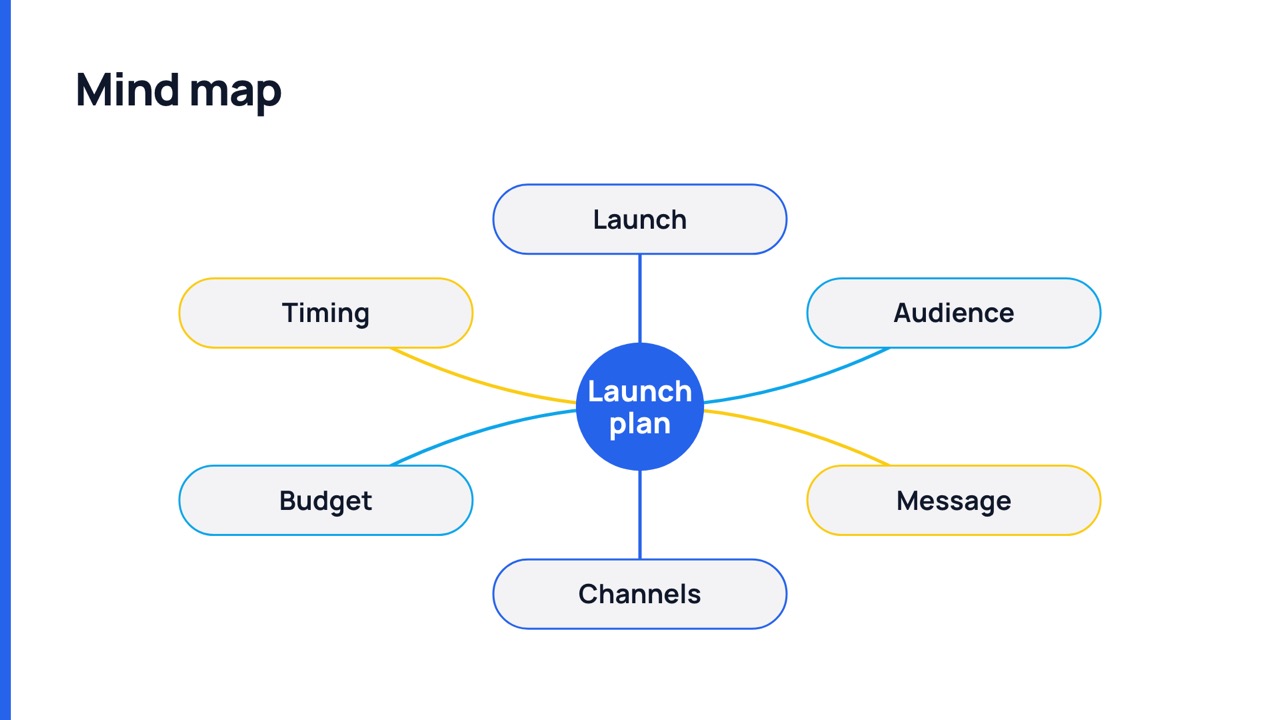
Mind map 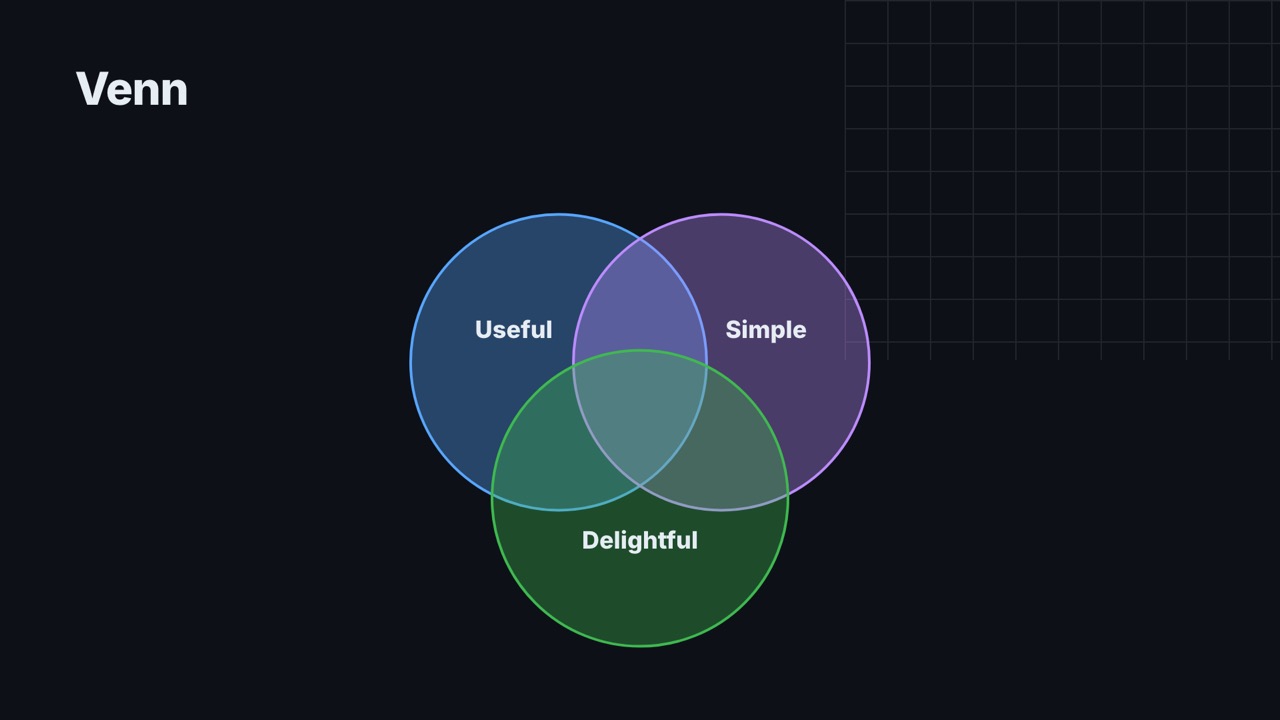
Venn 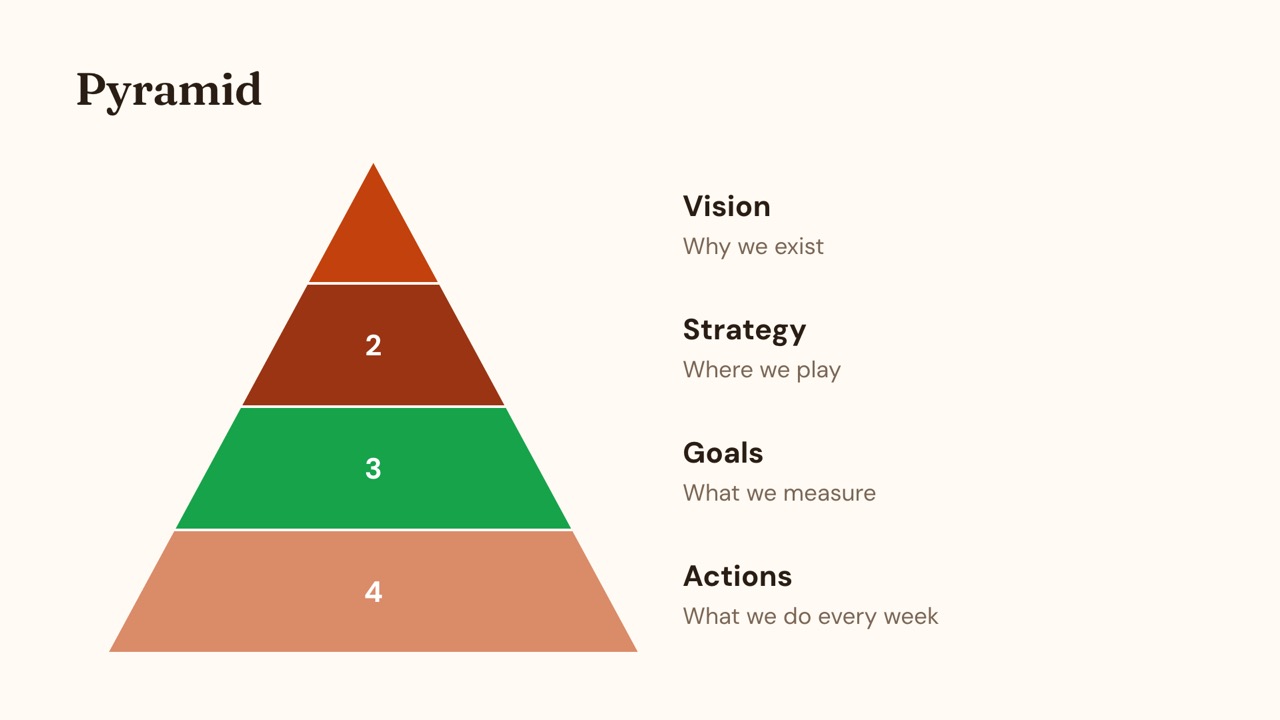
Pyramid 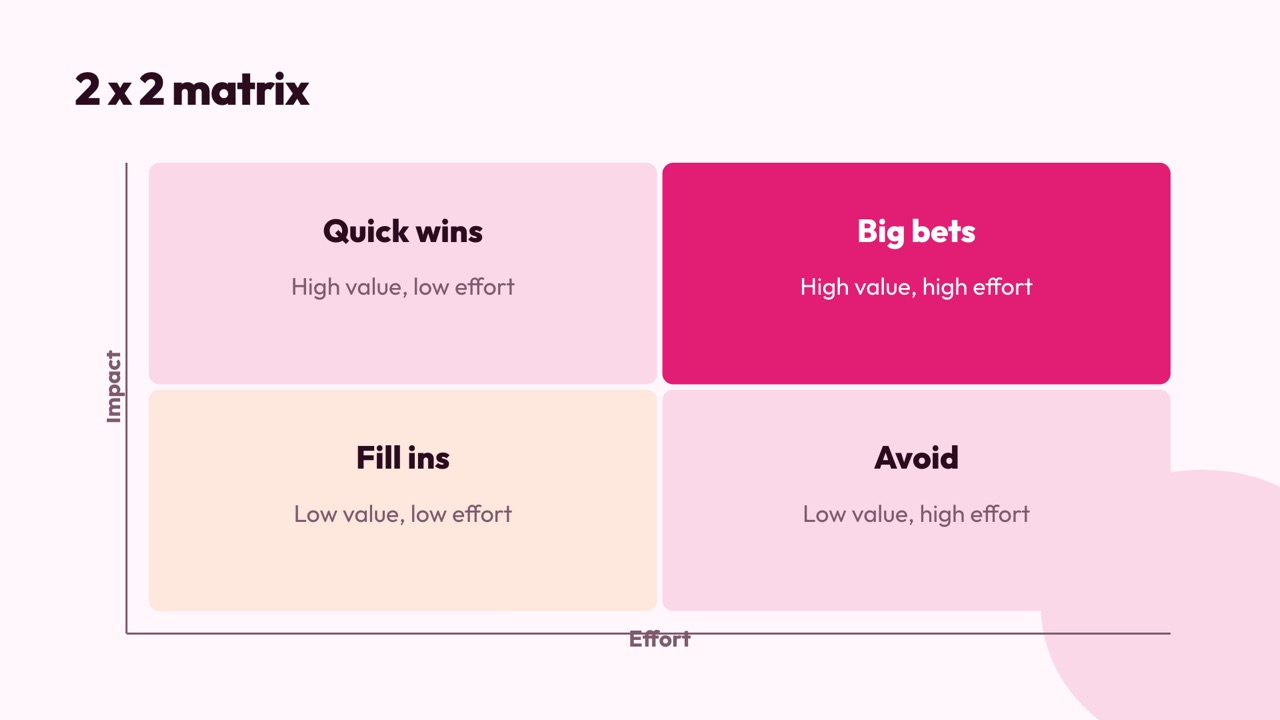
2 x 2 matrix
How it works
- 1
Add a chart or a diagram
Pick a type from the Chart or Diagram menu.
- 2
Bring your data
Type it, paste it from a spreadsheet or import a file.
- 3
Style and present
Pick colours, labels and an animation, then present.
Questions
Can I paste data from a spreadsheet?
Yes. Copy cells from any spreadsheet and paste them into the chart data grid, or import a CSV or Excel file.
Will the AI make up numbers?
No. Charts are only built from numbers you provide. Without numbers, the AI uses diagrams, timelines or key points instead.
Do charts stay editable in PowerPoint?
Standard charts export as native PowerPoint charts with their data. Unusual visuals are placed as pictures in the same spot.
Are the maps free to use?
Yes. Map shapes come from openly licensed data and are drawn in your theme colours.
Related features
- Slide editorA full slide editor in your browser: drag, resize, rotate, snap, align, group and lock. Rich text, shapes, icons, images, charts, tables, video and code blocks.
- AI presentation makerDescribe your talk or upload a Word, PDF or Markdown file. SlidesBat writes an outline you can edit, then designs every slide with real layouts, photos and notes.
- PowerPoint, PDF and PNG exportDownload decks as PowerPoint files with real, editable text, shapes, tables and charts, as crisp PDFs, or as PNG images. Memos export to PDF and Word.

Make your next deck in minutes
Free to start. No credit card. One OfficeBats account for every Bats app.